Seawater gets its familiar salty taste from dissolved minerals, but the amount of salt—salinity—is not the same everywhere. From the nearly fresh waters of the Baltic Sea to the hypersaline Dead Sea, the concentration of dissolved salts varies dramatically across the planet’s water bodies. Understanding what sea salinity is, how it is measured, and why some seas are saltier than others is key to grasping ocean circulation, marine life, and even climate patterns.
What Is Sea Salinity and How Is It Measured?
🧪 Definition
Salinity is the concentration of dissolved salts in seawater, usually expressed in parts per thousand (ppt) or grams per liter (g/L).
📊 Global Average
World ocean average is about 35 ppt (3.5%). Values range from <10 ppt in brackish seas to >300 ppt in hypersaline lakes.
🗺️ Map & Data
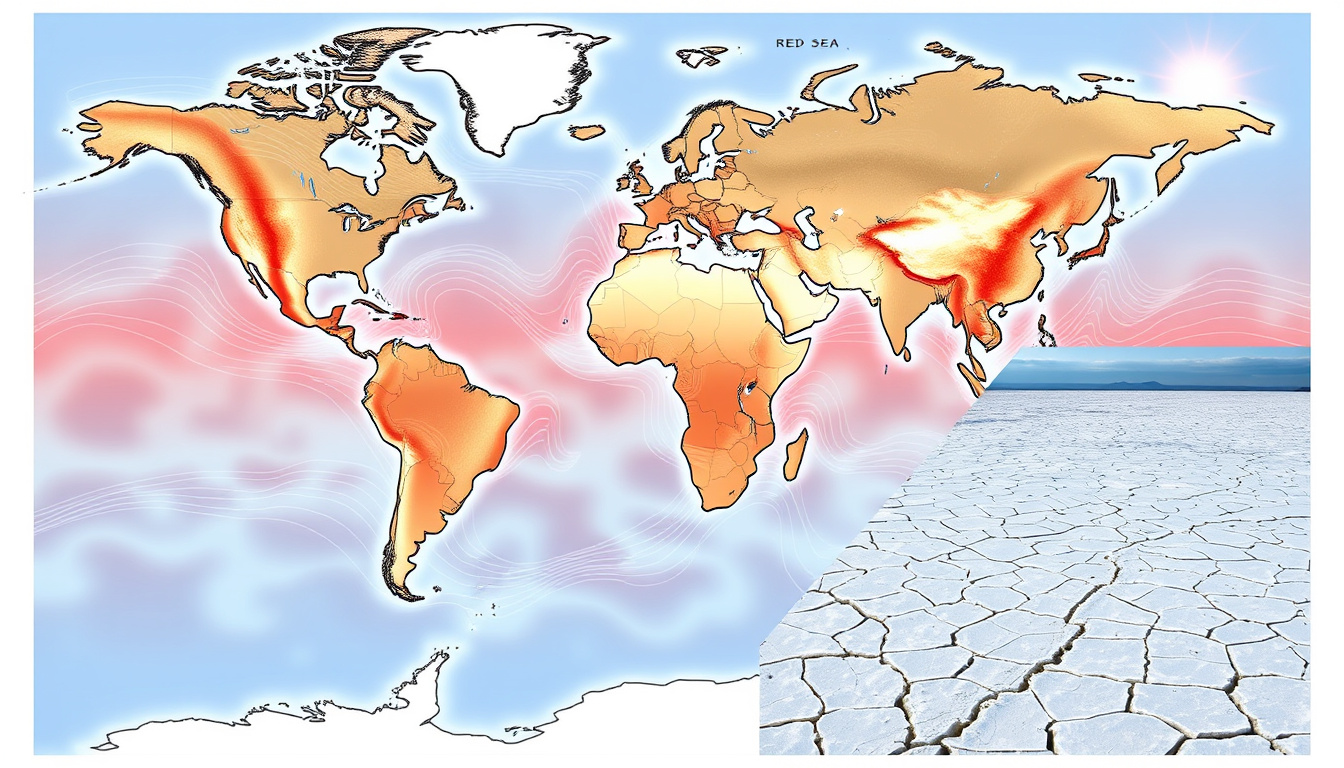
Interactive salinity maps are available via NOAA, Copernicus, and Wikipedia. Salinity varies by latitude, evaporation, and freshwater input.
🌍 Why It Matters
Salinity influences ocean currents, marine ecosystems, and the water cycle. High/low extremes shape unique habitats (e.g., Dead Sea).
Key insights about sea salinity
- The average salinity of the global ocean is 35 ppt, but regional variations are dramatic.
- The Dead Sea is the most saline water body (around 340 ppt), while the Baltic Sea is one of the least salty (7–8 ppt).
- Salinity is primarily driven by evaporation, precipitation, river inflow, and ice formation/melting.
- Sea salinity maps (e.g., from NOAA) show a distinct pattern: higher salinity in subtropics, lower near poles and coasts.
- Understanding sea salinity helps predict climate change impacts because salt alters water density and circulation.
Salinity snapshot: from global average to specific seas
| Sea or Water Body | Salinity (ppt) | Salinity (%) | Notes |
|---|---|---|---|
| World Ocean Average | 35 | 3.5% | Standard reference |
| Dead Sea | ~340 | 34% | Hypersaline, no outlet, intense evaporation |
| Red Sea | 40–41 | 4.0–4.1% | High evaporation, limited freshwater input |
| Mediterranean Sea | 38–39 | 3.8–3.9% | High evaporation, semi‑enclosed |
| Baltic Sea | 7–8 | 0.7–0.8% | Large freshwater inflow from rivers, limited connection to ocean |
| Bering Sea | 32–33 | 3.2–3.3% | Polar region, ice melt reduces salinity slightly below ocean average |
Salinity is measured through two main approaches: in situ sensors placed directly in the water that use electrical conductivity, and satellite missions that estimate sea‑surface salinity from space. NASA and ESA datasets include Aquarius, SMAP, and SMOS. Satellite products are valuable for global coverage but can have gaps near coasts where land interferes with measurements. (NOAA Sea Water Education)
Which Seas Have the Highest and Lowest Salinity?
Dead Sea: the saltiest water body
The Dead Sea is a landlocked lake with no outlet. Intense evaporation continuously concentrates salts while freshwater input is minimal. Its salinity reaches about 340 ppt, nearly ten times the ocean average. (Wikipedia – Seawater)
Because the Dead Sea is so salty, it cannot support fish or most aquatic life. Only certain microorganisms survive. The high density makes swimming almost effortless, but the water is dangerous if swallowed.
Red Sea and Mediterranean: high evaporation zones
The Red Sea records salinity between 40 and 41 ppt, while the Mediterranean Sea sits at 38–39 ppt. Both are semi‑enclosed basins situated in hot, dry regions where evaporation greatly exceeds precipitation and river inflow. (Science Learning Hub – Ocean salinity)
Baltic Sea: one of the least salty seas
The Baltic Sea is a brackish inland sea fed by numerous rivers. Limited water exchange with the North Atlantic keeps its salinity low, averaging only 7–8 ppt. Spring melt and rainfall can lower it even further seasonally. (Copernicus Marine Service – Baltic Salinity)
Bering Sea: slightly below average
Located at high latitudes, the Bering Sea experiences sea‑ice formation and melt that moderate its salinity. Typical values range from 32 to 33 ppt, slightly below the global ocean mean. Ice rejection during formation raises salinity locally, while meltwater dilutes it.
Why Is the Sea Salty and Why Does Salinity Vary?
Ocean salinity is not constant. Several natural processes raise or lower the concentration of dissolved salts. The most important factors are evaporation, precipitation, river inflow, ice formation and melting, and ocean currents. (Wildlife Trusts – Why is the sea salty?)
Evaporation and precipitation
In warm, dry regions evaporation removes freshwater, leaving salts behind and raising salinity. Conversely, heavy rainfall and river runoff add freshwater, diluting the seawater. This explains why the subtropics have higher salinity and the equatorial belt is slightly fresher.
Ice formation and melting
When seawater freezes, most of the salt is excluded from the ice crystals, making the surrounding water saltier. When sea ice melts, it adds freshwater and lowers salinity. This process is especially active in polar regions like the Bering Sea and around Antarctica.
River inflow
Large rivers discharge enormous volumes of freshwater into the ocean. The Baltic Sea receives water from over 200 rivers, which is the primary reason for its low salinity. Estuaries and coastal areas are typically fresher than the open ocean.
Ocean currents
Currents transport water with different salinity across the globe. For instance, the Gulf Stream carries salty subtropical water northward, while the Labrador Current brings fresher polar water south along the coast of North America.
The Baltic Sea’s low salinity is the result of high freshwater input from rivers combined with a very narrow and shallow connection to the North Sea. Only about 0.1% of its water volume is exchanged with the Atlantic each year, so salts are not replenished efficiently.
Where to Find a Sea Salinity Map and Data?
Global maps of sea‑surface salinity are freely available from several scientific agencies. NASA offers an interactive globe and monthly salinity maps via its Salinity website. NOAA’s World Ocean Atlas 2023 provides authoritative climatological datasets, including salinity at various depths. Copernicus Marine Service provides specialised views, such as Baltic Sea salinity, with regular updates. (NASA Aquarius Mission)
Satellite salinity products (from SMOS, SMAP, and Aquarius) give global coverage but can have gaps near coastlines. For specific scientific comparisons, datasets differ in averaging period (daily, 8‑day, monthly), projection (e.g., Mollweide), and units (ppt vs. PSU). ESA reports that combining missions improved map precision by about 30% by reducing inter‑calibration error.
NASA’s interactive global maps display monthly salinity averages. They use the Practical Salinity Scale (PSS), where PSU and ppt are treated as equivalent. The maps are useful for spotting large‑scale patterns like the high‑salinity bands in the subtropics and the fresher polar and equatorial regions.
How Has the Study of Sea Salinity Developed Over Time?
- ~1670s – Robert Boyle conducts early experiments on seawater salinity, identifying major dissolved salts.
- 1870s – The HMS Challenger expedition systematically measures salinity across all oceans, establishing a global baseline.
- 1950s – Development of conductivity‑based salinity measurement (CTD sensors) revolutionises accuracy.
- 2000s – Satellite remote sensing (SMOS, Aquarius, SMAP) provides global sea‑surface salinity maps for the first time.
- Present – Ongoing monitoring by NOAA, Copernicus, and the Argo float network tracks salinity changes linked to climate change.
What Do We Know and What Is Still Uncertain About Sea Salinity?
| Established information | Information that remains unclear |
|---|---|
| Average ocean salinity is ~35 ppt, confirmed by thousands of measurements. | Local salinity can fluctuate seasonally (e.g., Baltic Sea after spring melt). |
| Specific sea salinities (Dead Sea ~340 ppt, Baltic ~7–8 ppt) are confirmed by multiple datasets. | Extreme values for the Dead Sea vary slightly between sources (330–350 ppt) due to depth and recent dilution from rainfall. |
| Salinity is measured using conductivity, temperature, depth (CTD) sensors with high precision. | Bering Sea salinity data may vary slightly between years due to ice dynamics. |
Long‑term trends in salinity are still being established; climate model projections have low confidence for regional changes. Detailed salinity maps for remote ocean regions (e.g., the Southern Ocean) rely on sparse Argo float data.
Why Does Sea Salinity Matter for the Planet?
Sea salinity is a fundamental property of the ocean that shapes marine environments and global climate. Saltier water is denser, causing it to sink and drive thermohaline circulation—a global conveyor belt of deep ocean currents that regulate climate. Salinity also affects the habitats of marine organisms; only specially adapted species can survive in the extreme conditions of the Dead Sea or the brackish Baltic. Monitoring salinity helps scientists understand changes in the water cycle, ice melt, and ocean heat storage.
What Do Authoritative Sources Say About Sea Salinity?
“Sea water salinity is expressed as a ratio of salt (in grams) to liter of water, written parts per thousand (ppt).”
— NOAA
“On average, seawater in the world’s oceans has a salinity of about 3.5% (35 g/L, 35 ppt, 600 mM).”
— Wikipedia – Seawater
“Anyone who has tasted seawater will know that it’s incredibly salty – it actually has an average salt content of around 3.5%.”
— Wildlife Trusts
What’s Next in Sea Salinity Research?
Emerging research focuses on real‑time monitoring by satellites like NASA’s SMAP, the impact of Arctic freshening on global ocean circulation, and the use of IPCC climate projections to model future salinity trends. These tools will help refine predictions of how changing salinity will affect marine ecosystems and climate patterns worldwide. For further reading, explore the SMAP Salinity Measurement and Mapping and Global Sea Surface Salinity Maps and Atlases.
Frequently Asked Questions About Sea Salinity
Is the ocean salinity constant everywhere?
No, salinity varies by location due to evaporation, precipitation, river runoff, and ice formation. The global average is 35 ppt, but regional values range from <10 ppt to >40 ppt in open oceans, and much higher in enclosed seas.
What does ‘ppt’ stand for in salinity?
PPT stands for ‘parts per thousand’. It indicates grams of salt per kilogram (or liter) of seawater. For example, 35 ppt means 35 grams of salt per 1000 grams of water.
How does salinity affect ocean currents?
Saltier water is denser, causing it to sink. This drives thermohaline circulation, a global conveyor belt of deep ocean currents that regulate climate.
Why is the Dead Sea so much saltier than the ocean?
The Dead Sea is a landlocked lake with no outlet. High evaporation rates continuously concentrate salts, while freshwater input is minimal, leading to salinity around 340 ppt, nearly 10 times the ocean average.
Can salinity change over time?
Yes, salinity fluctuates seasonally (e.g., rainy seasons dilute surface seawater) and over longer periods due to climate change, melting ice, or human activities like dam construction.

Olivia Hartley is Business & Economy Correspondent at DailyCity.co.uk, reporting on the city economy, property, retail, hospitality and employment.